Venn Diagrams
Drawing sets as pictures
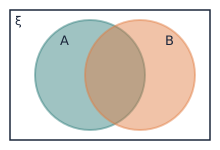
A Venn diagram is like two overlapping goat pens sharing a fence: some goats belong to pen A only, some to pen B only, and some stand in the shared middle bit belonging to both.
The rectangle represents ξ (everything), and circles inside it represent each set.
Example: ξ = {1,2,3,4,5,6,7,8}, A = {2,3,4,5}, B = {4,5,6,7}. The overlap (both pens) is {4,5}. Only in A: {2,3}. Only in B: {6,7}. Outside both: {1,8}.
Lesson Image
Discussion
How was the lesson? Discuss Lesson
Related Exercises
Draw and read Venn diagrams
ξ = {1..10}, A = {2,4,6,8,10}, B = {1,2,3,4,5}. Draw the Venn diagram and list the elements in each region.From …
View Exercise Submit Exercise